

Such a strategy is not going to make you rich, but no strategy does at the Roulette, especially the American one which has both a "0" and a "00" -two neutral numbers thrown in to enhance house odds. The idea of doubling every time is that eventually the colour you bet on is bound to appear, and you will win back all your fiches, plus one. Example: lose 1 - lose 2 - lose 4 - lose 8 - lose 16 - win 32: the sum is 32-16-8-4-2-1, which is exactly one fiche.
There is, of course, one problem with this strategy: roulette tables have a maximum bet, which prevents you from continuing the doubling ad infinitum, even if you had that much money to throw on the table. Moreover, a very rare fluctuation with a uninterrupted, arbitrarily long streak of odd-colour occurrences, is bound to make you broke if you play for long.
While one cannot change the table rules, and thus has to live with a maximum bet, the rare fluctuations can be kept rare by playing shorter games! If one defines before playing a fixed exit strategy -say, leave the table upon winning a certain number of fiches-, this is going to make it easier to prevent the killing streaks to occur during your game.
I decided to put together a simple program to extract winning probabilities with the above strategy. The program simulates the outcome of reds, blacks, and neutral numbers in 10,000,000 sessions of up to 200 wheel turns -the typical duration of a night-long game. The user may define the number of fiches after which he or she leaves the table (less than 200, of course, since we can win at most one fiche per turn of the wheel with our strategy), and the maximum bet allowed. Below I detail some results.
If the table has a maximum bet of 100 fiches, we get:
max 200 rolls, quit at +10: won 93.3435%, avg win= -9.2293
max 200 rolls, quit at +20: won 87.1386%, avg win=-17.4491
max 200 rolls, quit at +50: won 71.2252%, avg win=-36.6622
max 200 rolls, quit at +100: won 56.9104%, avg win=-51.7284
With a maximum bet of 1000 fiches, we get instead:
max 200 rolls, quit at +10: won 99.1284%, avg win= -9.2005
max 200 rolls, quit at +20: won 98.2628%, avg win=-18.2627
max 200 rolls, quit at +50: won 95.7134%, avg win=-44.6285
max 200 rolls, quit at +100: won 91.6532%, avg win=-78.0571
And with a maximum bet of 10000 fiches (if you can afford it!), we get:
max 200 rolls, quit at +10: won 99.876%, avg win=-11.8301
max 200 rolls, quit at +20: won 99.751%, avg win=-23.5798
max 200 rolls, quit at +50: won 99.379%, avg win=-59.0183
max 200 rolls, quit at +100: won 97.935%, avg win=-107.22
You may notice several things from the numbers above. First of all, the obvious thing that, as the maximum bet is increased, the chance of going home positive increases. Second, the average win is always negative. This should also not surprise you much: on average, the Casino wins!
The third thing to note is that the probability to end up winning is a decreasing function of your greed. The more you want to win, the more likely it is that you lose. If you decide for a very conservative exit strategy (say, go home if you win 10 fiches), then you have very good odds of making it, especially with a high table maximum.
This strategy is not for the faint hearted: during a bad streak you might have to put 1000 units on the table, in order to try and win back the original unit you bet at the start of the streak. Mathematically this makes sense, but from a psychological point of view, it is rather absurd.
For those who want to know more about how the above numbers arise, I have prepared three graphs. The first one shows the distribution of fiches won (the total gain) at the end of each session -assuming, as we have, that we either stop when we win 50 fiches, or that we go on for 200 turns of the wheel. We have also assumed that when we reach the maximum bet and we lose, we continue betting that maximum amount until we win. Here is the distribution:
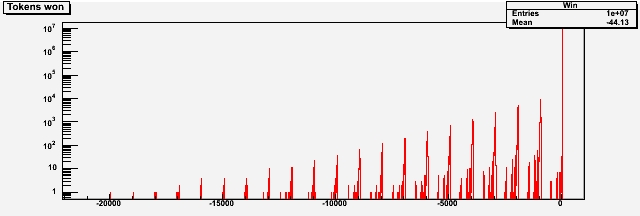
As you see, there is a large peak at wins of +50, but there is a long tail of very bad losses. The average ends up at -44 tokens, but there are non-zero chances of losing really large sums.
The secon graph shows the distribution of the longest streak of losses. This is what determines the long negative tail in the previous graph:
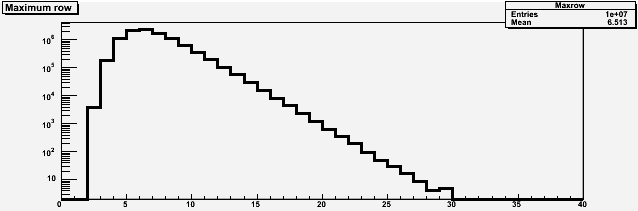
The third graph shows the correlation between longest streak (on the vertical axis) and total gain (on the horizontal one). When bad streaks of losses do not occur, we end up winning (the blob of black crosses at the bottom right); when the streaks become longer, we hit the maximum bet, and we start losing money. The longer the streak, the worse it gets.

I hope this is useful for those who apply Hank's "double it" strategy at Roulette. My personal advice, however, is to avoid Roulette tables altogether. As Hank says, play Poker or Blackjack instead!


Comments