


Those of you who have been reading Genomicron for some time will have seen most of these already, but it seems worthwhile reviewing them here at the new blog. The game is simple: identify what is wrong with these figures which have been published in science magazines or scientific journals.
(To view larger images, right-click and select "view image" in Firefox -- you're on your own in other browsers).
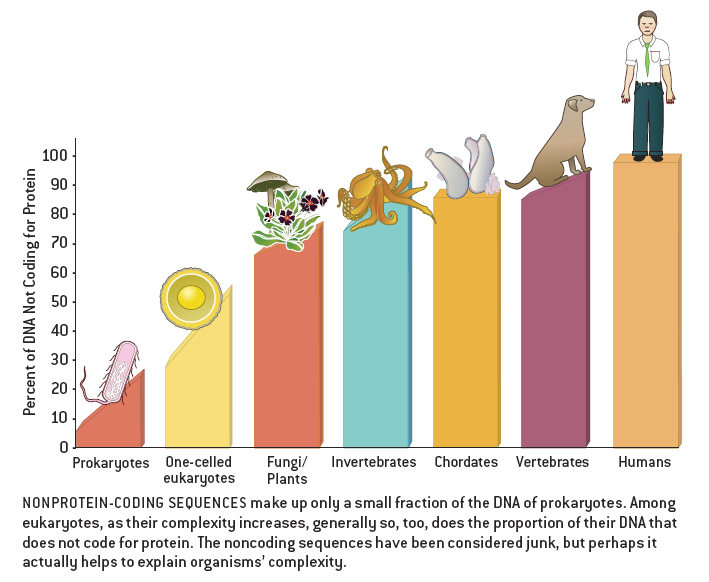
1) The infamous "dog's ass plot":
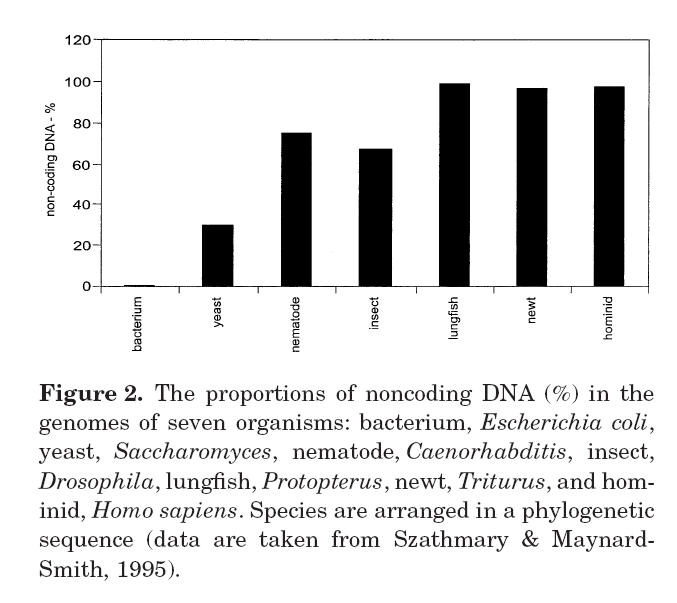
2) More non-coding sequences:
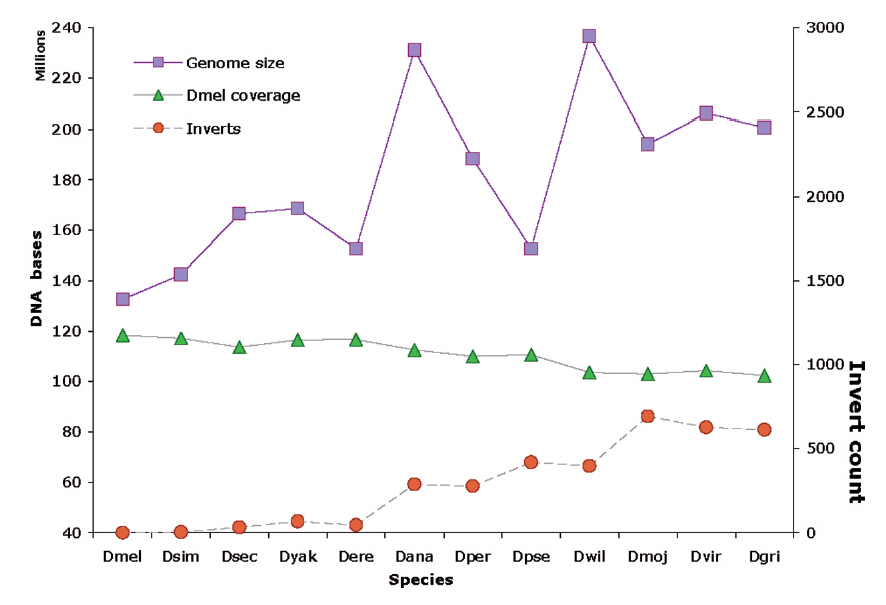
3) Fly genomes:
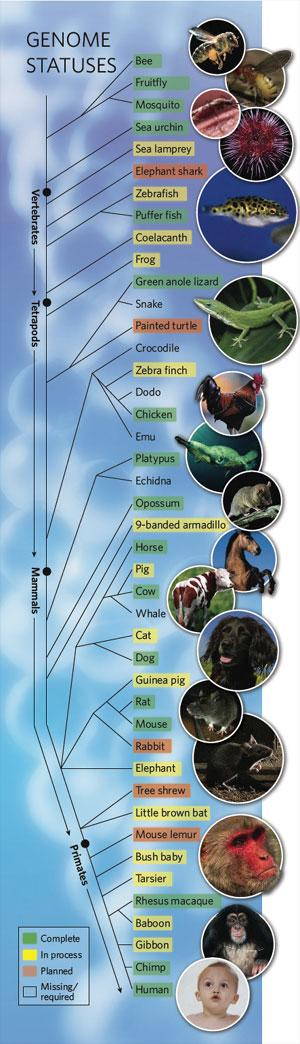
4) Sequencing data:
Sources:
Brown, S. 2008. Top billing for platypus at end of evolution tree. Nature 453: 138.
Gilbert, D.G. 2007. DroSpeGe: rapid access database for new Drosophila species genomes. Nucleic Acids Research 35 (Database Issue): D480-D485.
Mattick, J.S. 2004. The hidden genetic program of complex organisms. Scientific American Oct: 60-67.
Stebbing, A.R.D. 2006. Genetic parsimony: a factor in the evolution of complexity, order and emergence. Biological Journal of the Linnean Society 88: 295-308.


Comments